
Home
Background
Interpretation
Manx Projects
Y-STR statistics
Overview
This page provides some numbers and calculations to support the analysis and interpretation of Y-STR test results. It serves as reference material for the Y-STR analysis page.
Mutation Rates of individual Y-STR markers
The table below gives estimates for the mutation rates of the Y-STR markers measured by the most heavily used genealogical Y-DNA test (the Y37 provided by FTDNA). The entries appear in the same order as provided there and the mutation rates are given as the probability of a mutation per generation. Certain of the entries relate to multi-copy markers and in these cases the quoted mutation rate relates to the probability of any mutation in any of the corresponding hyphonenated values. These multi-copy markers are DYS385, DYS459, YCAII, CDY, DYF395S1 and DYS413 (all of which provide two values), and DYS464 (which gives four.)
| DYS393 | DYS390 | DYS19 | DYS391 | DYS385 | DYS426 | DYS388 | DYS439 | DYS389i | DYS392 |
| 0.001271 | 0.002011 | 0.002151 | 0.002371 | 0.002861 | 0.000092 | 0.000222 | 0.005091 | 0.002411 | 0.000521 |
| DYS389ii | DYS458 | DYS459 | DYS455 | DYS454 | DYS447 | DYS437 | DYS448 | DYS449 | DYS464 |
| 0.004651 | 0.007031 | 0.001322 | 0.000162 | 0.000162 | 0.002642 | 0.001311 | 0.001351 | 0.009981 | 0.005662 |
| DYS460 | YGATAH4 | YCAII | DYS456 | DYS607 | DYS576 | DYS570 | CDY | DYS442 | DYS438 |
| 0.005121 | 0.002551 | 0.001232 | 0.004321 | 0.004112 | 0.012401 | 0.009281 | 0.035312 | 0.003242 | 0.000341 |
| DYS531 | DYS578 | DYF395S1 | DYS590 | DYS537 | DYS641 | DYS472 | DYF406S1 | DYS511 | DYS425 |
| 0.001003 | 0.000613 | 0.000193 | 0.000223 | 0.001493 | 0.000653 | 0.000123 | 0.002223 | 0.001533 | 0.000243 |
| DYS413 | DYS557 | DYS594 | DYS436 | DYS490 | DYS534 | DYS450 | DYS444 | DYS481 | DYS520 |
| 0.000963 | 0.003453 | 0.000453 | 0.000143 | 0.000323 | 0.006863 | 0.000193 | 0.003173 | 0.004853 | 0.001953 |
| DYS446 | DYS617 | DYS568 | DYS487 | DYS572 | DYS640 | DYS492 | DYS565 | DYS710 | DYS485 |
| 0.003163 | 0.000583 | 0.000813 | 0.000803 | 0.001633 | 0.000253 | 0.000273 | 0.000983 | 0.018283 | 0.001323 |
| DYS632 | DYS495 | DYS540 | DYS714 | DYS716 | DYS717 | DYS505 | DYS556 | DYS549 | DYS589 |
| 0.000073 | 0.000993 | 0.001453 | 0.007733 | 0.001003 | 0.000703 | 0.001923 | 0.001423 | 0.004493 | 0.000823 |
| DYS522 | DYS494 | DYS533 | DYS636 | DYS575 | DYS638 | DYS462 | DYS452 | DYS445 | YGATAA10 |
| 0.000213 | 0.000243 | 0.003223 | 0.000883 | 0.000503 | 0.000953 | 0.000953 | 0.001373 | 0.001143 | 0.003923 |
| DYS463 | DYS441 | YGGAAT1B07 | DYS525 | DYS712 | DYS593 | DYS650 | DYS532 | DYS715 | DYS504 | DYS513 |
| 0.000973 | 0.002053 | 0.000843 | 0.001663 | 0.016383 | 0.000513 | 0.007583 | 0.004133 | 0.004163 | 0.005783 | 0.002543 |
| DYS561 | DYS552 | DYS726 | DYS635 | DYS587 | DYS643 | DYS497 | DYS510 | DYS434 | DYS461 | DYS435 |
| 0.001713 | 0.003103 | 0.000273 | 0.003253 | 0.001043 | 0.001343 | 0.000843 | 0.002933 | 0.000673 | 0.002283 | 0.000573 |
The figures above are approximate. Some of them are based on limited data. Also mutation rates can depend on other factors, including the specific allele and the age of the father. Sources for the quoted values are given below.
1  Y-Chromosone STR Haplotype Reference Database (https://yhrd.org/pages/resources/stats)
2  List of Y-STR markers on Wikipedia (https://en.wikipedia.org/wiki/List_of_Y-STR_markers#Mutation_rates)
3  Average of Heinila and McDonald estimates (http://dna.cfsna.net/HAP/Mutation-Rates.htm)
Average genetic difference between Y-STR markers per generation of separation
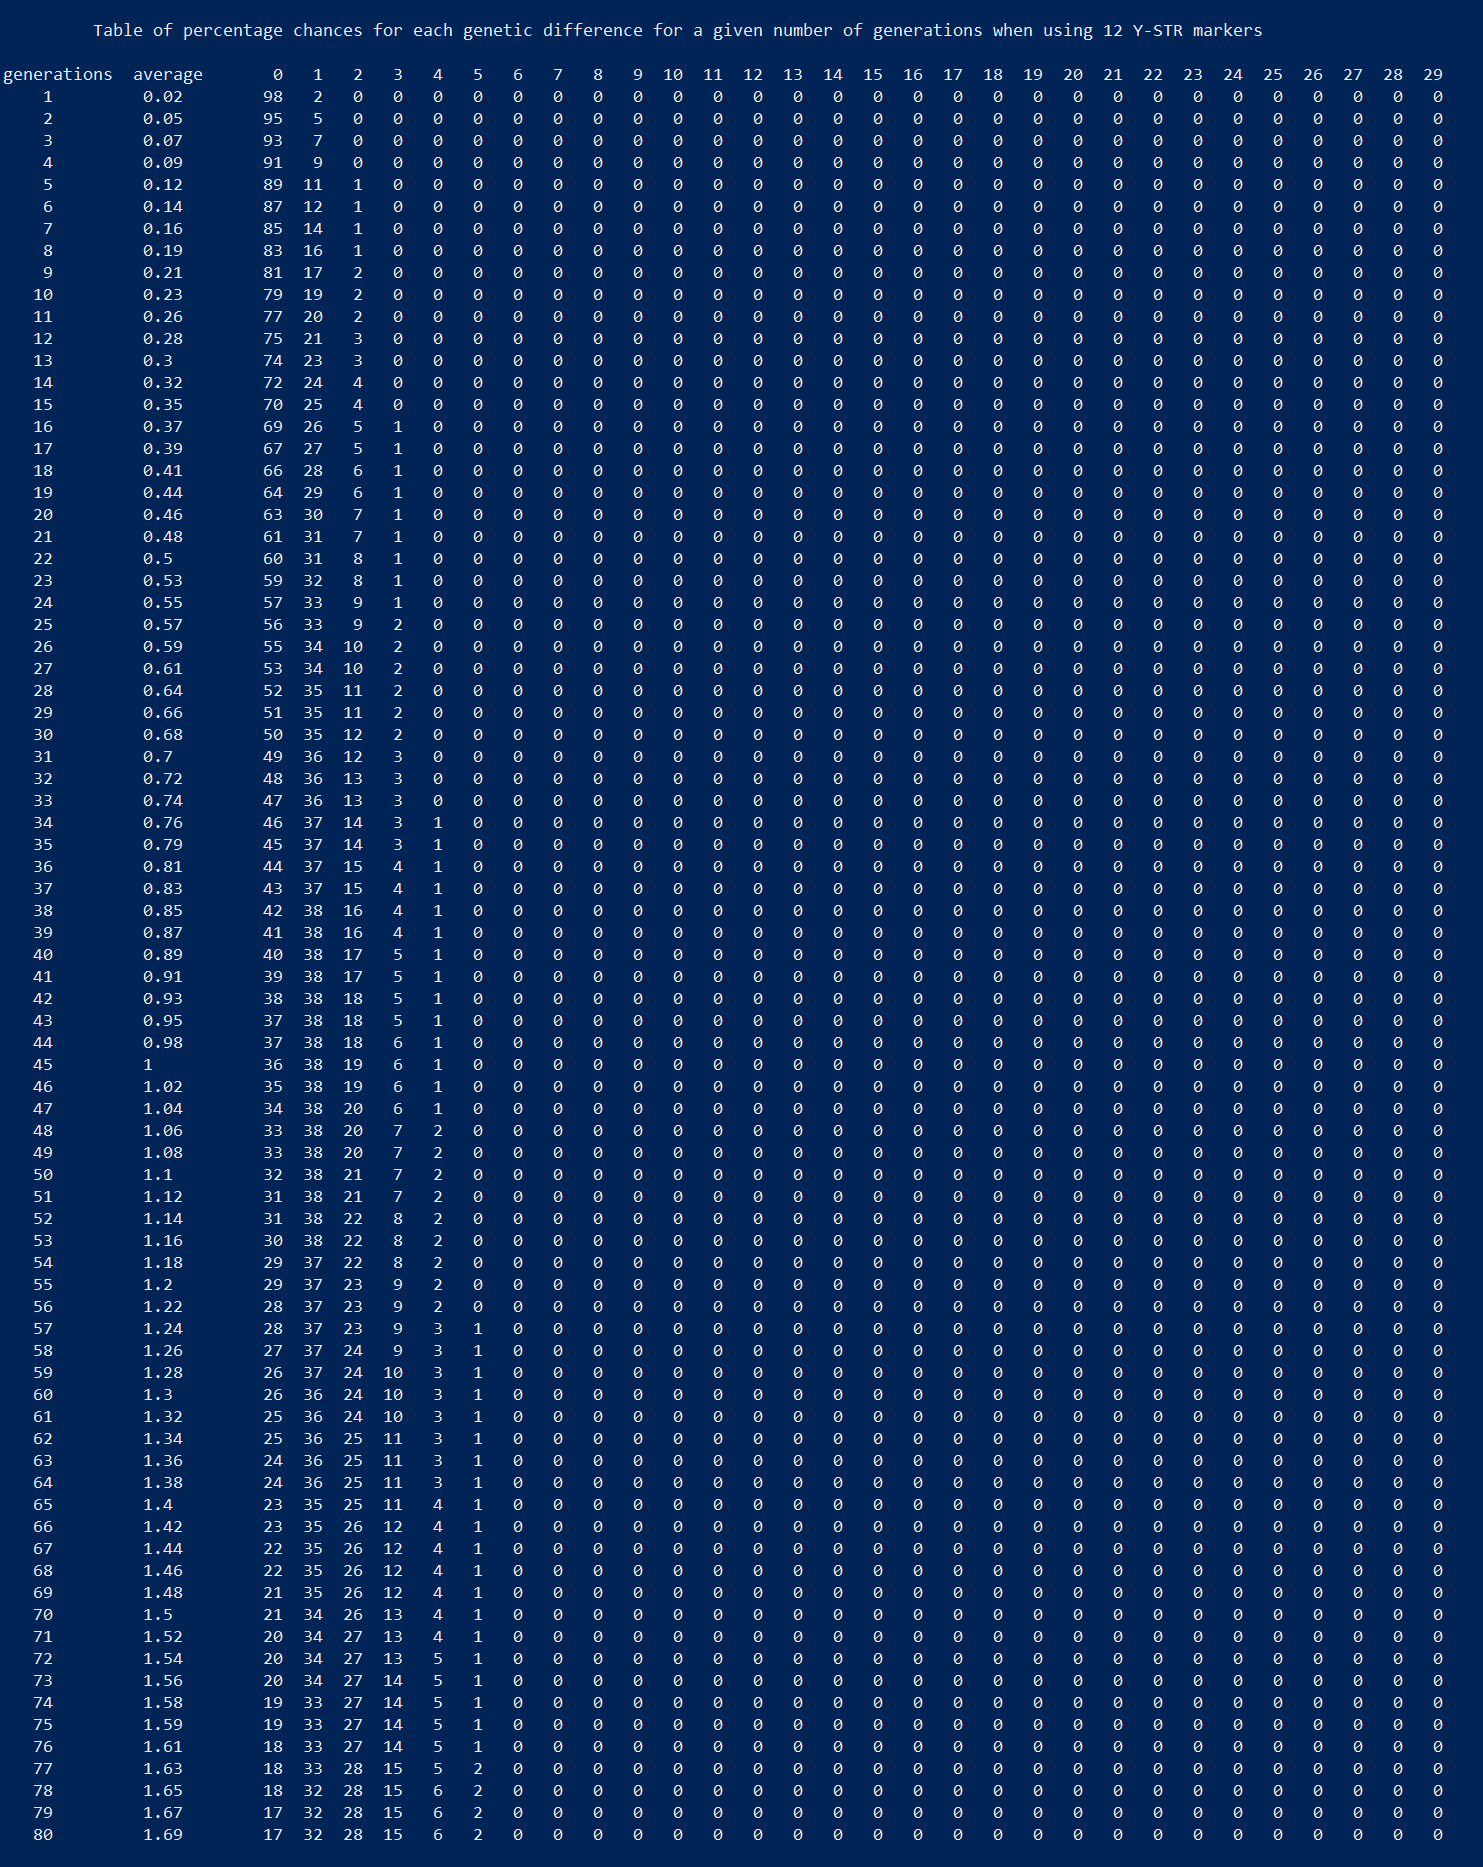
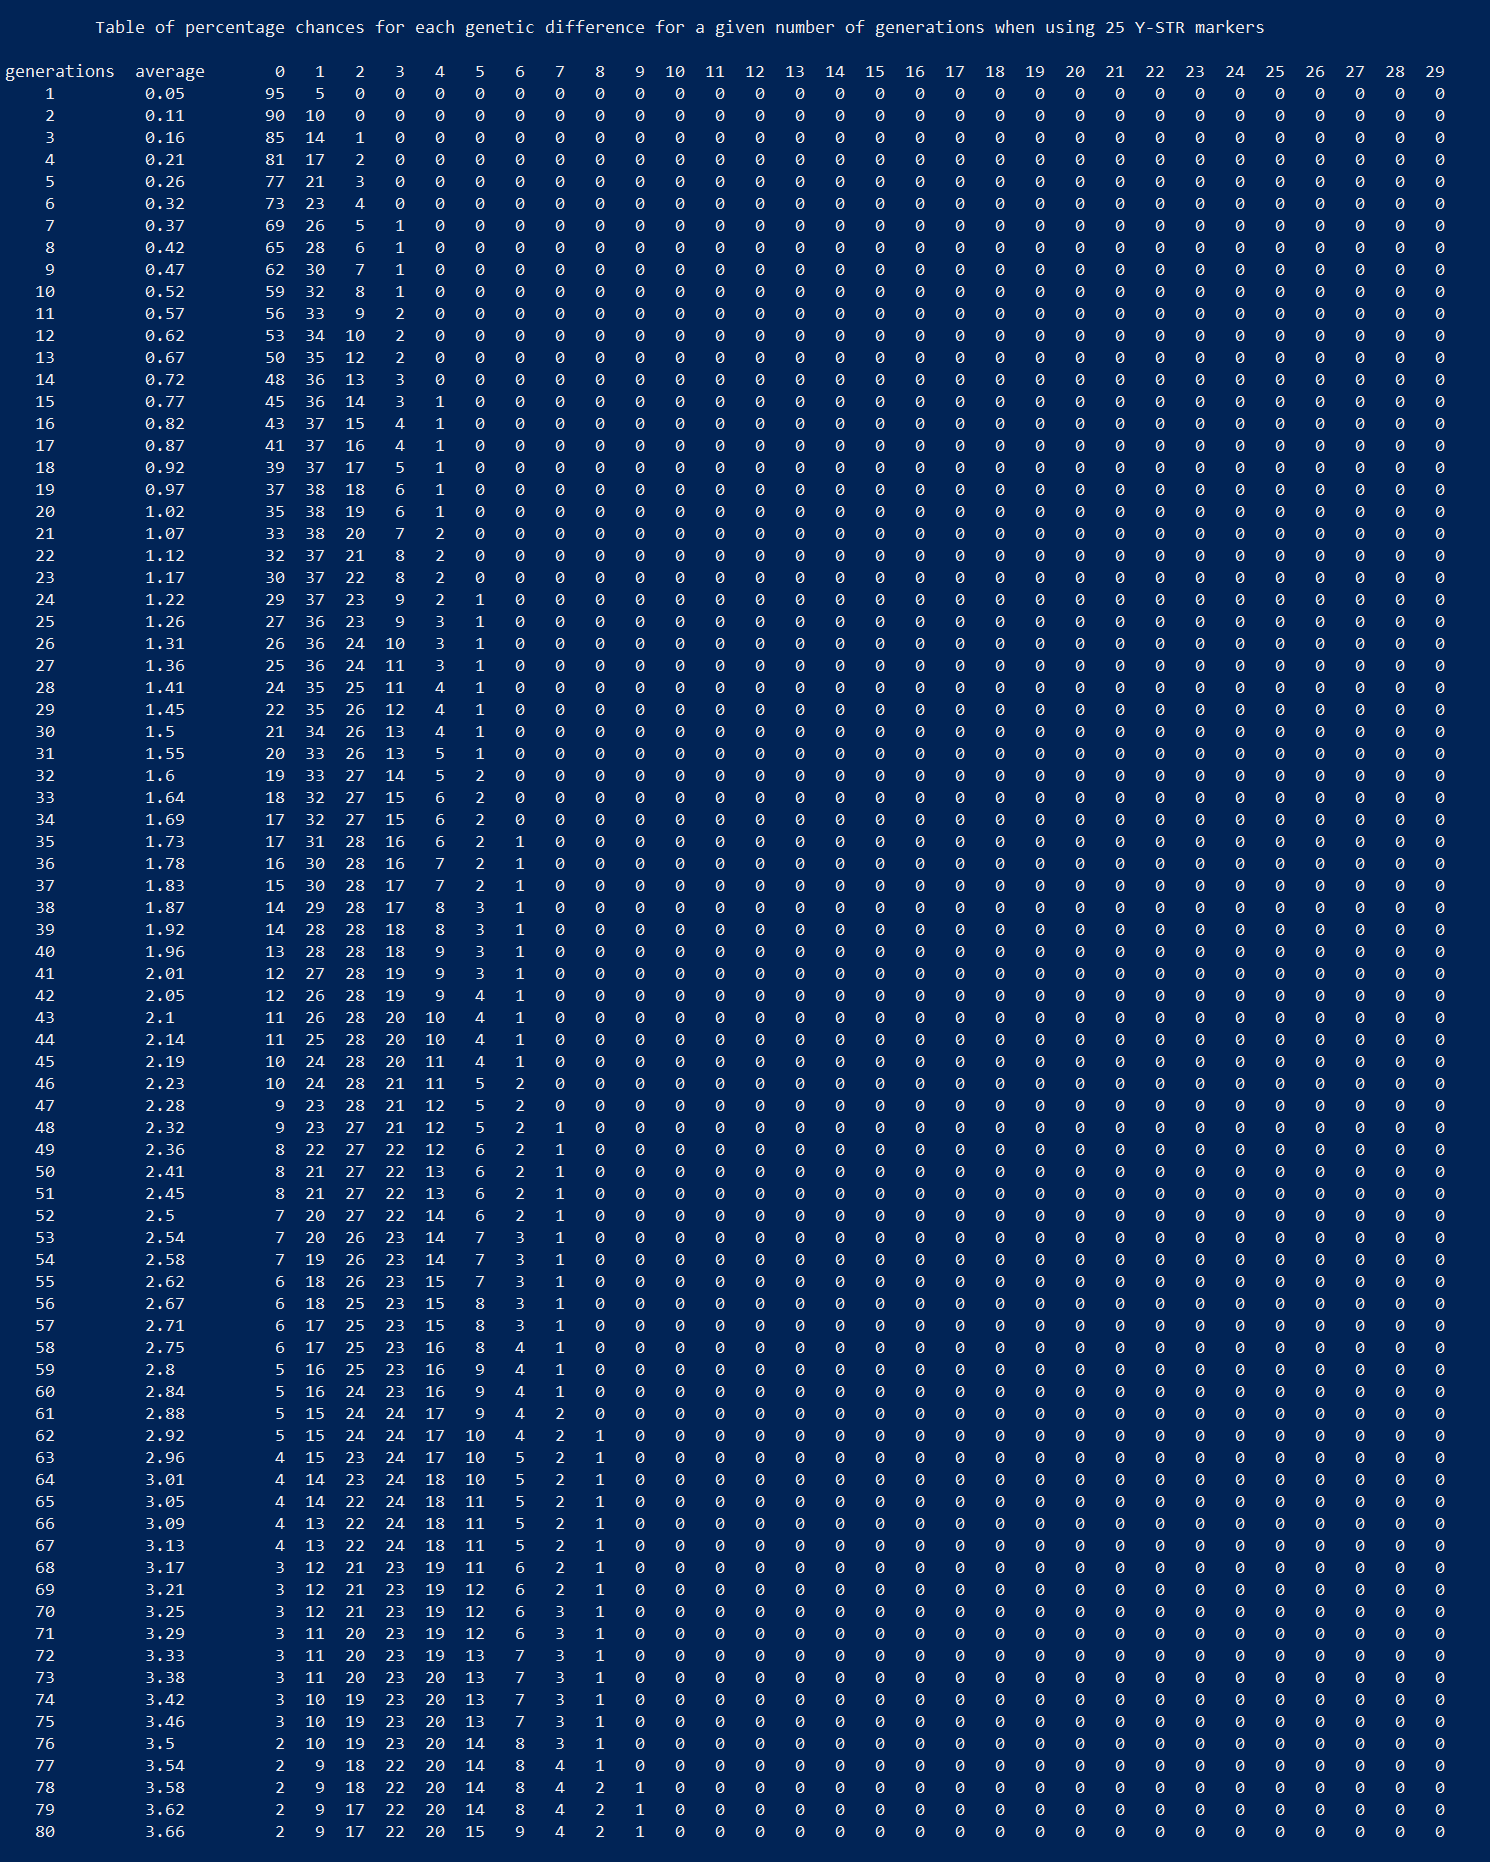
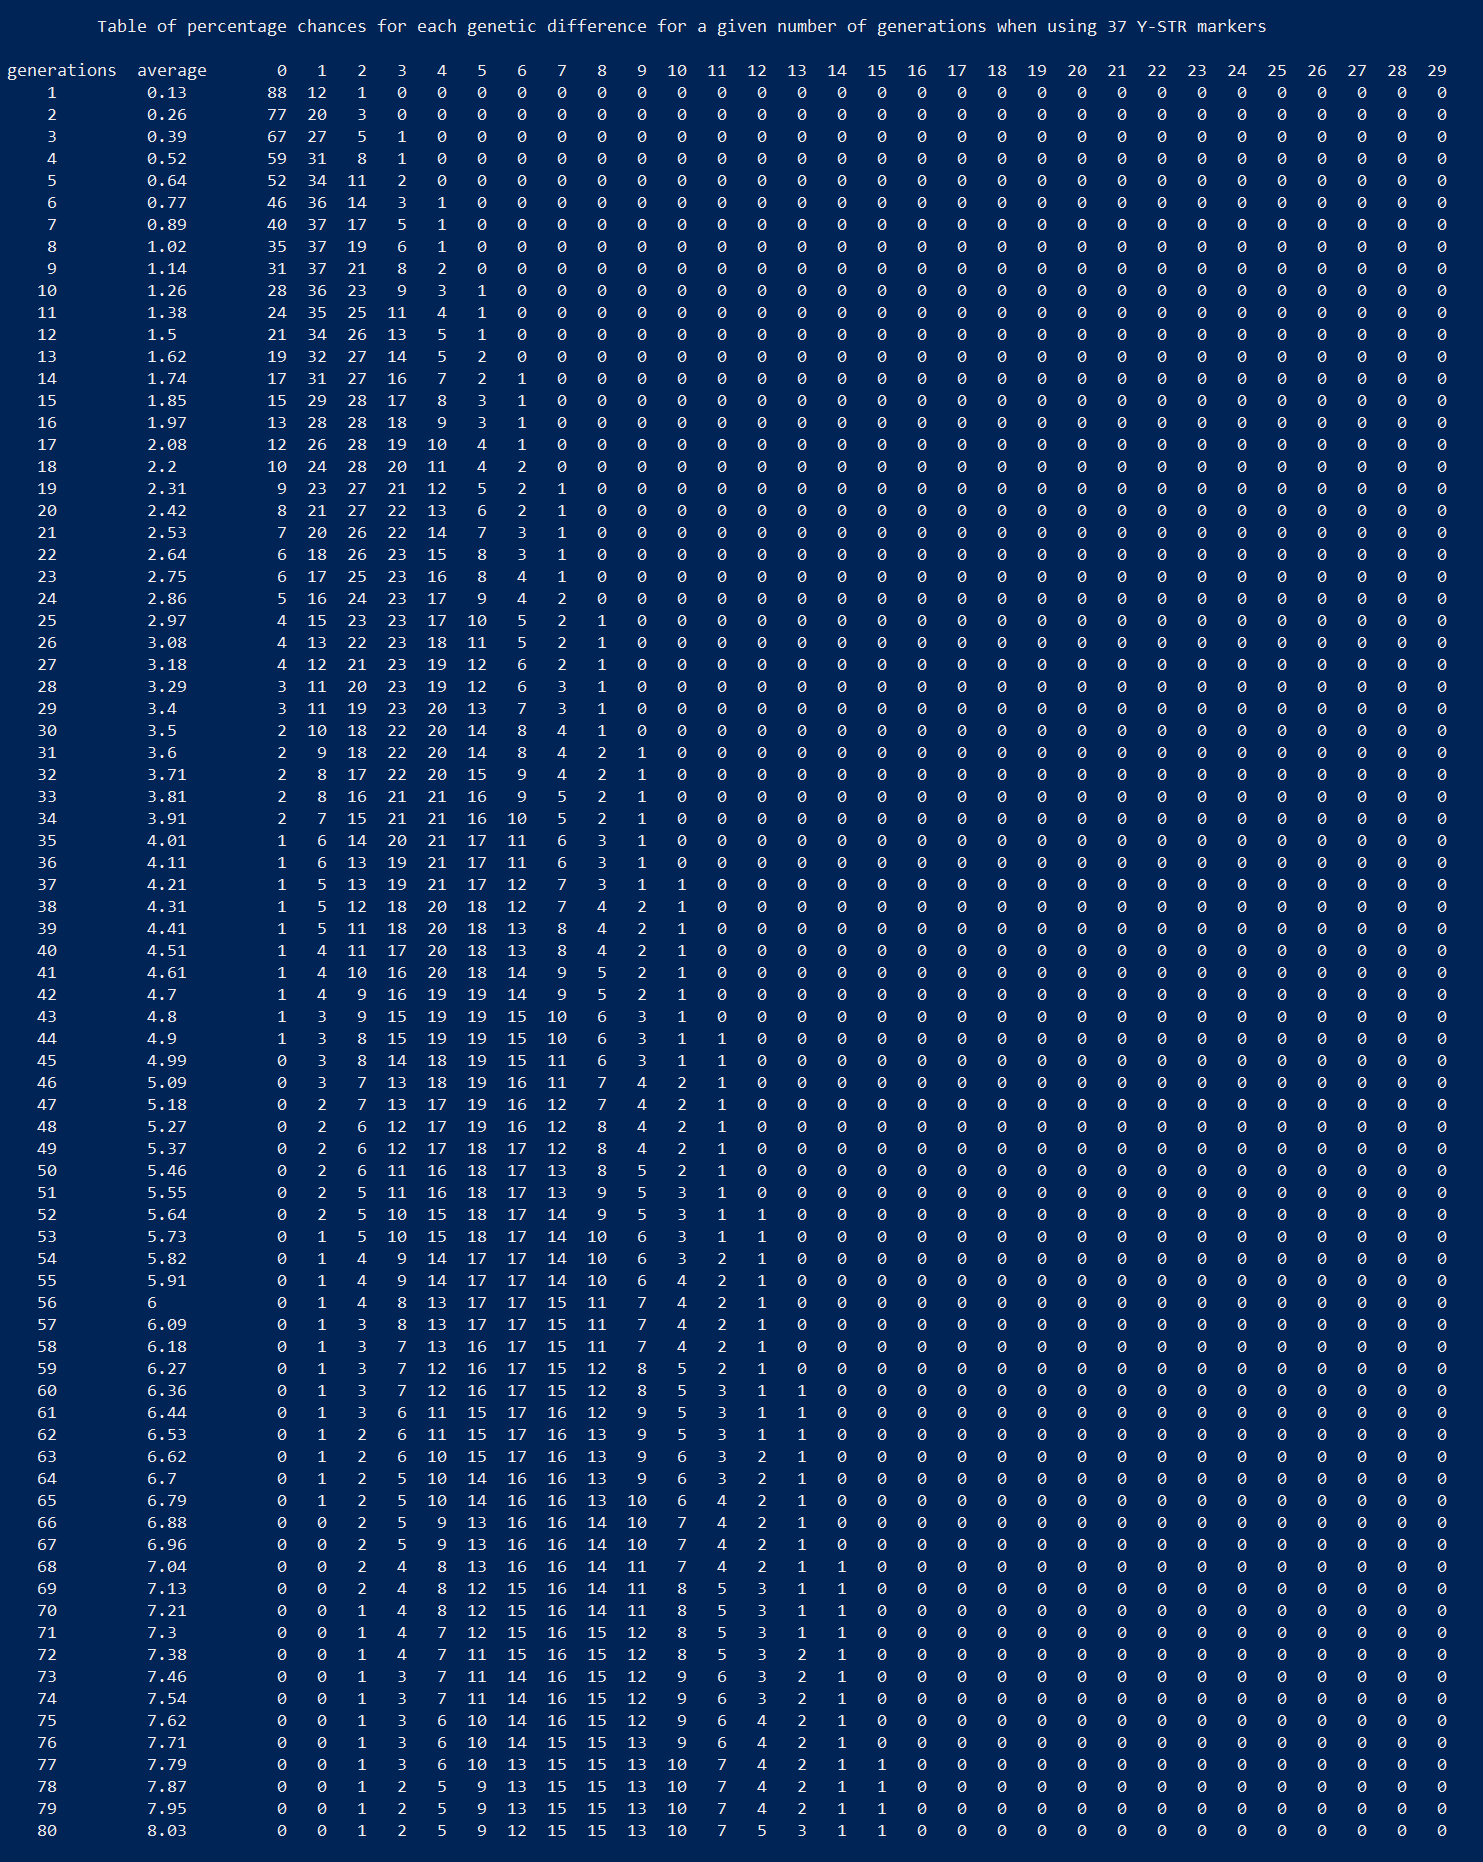
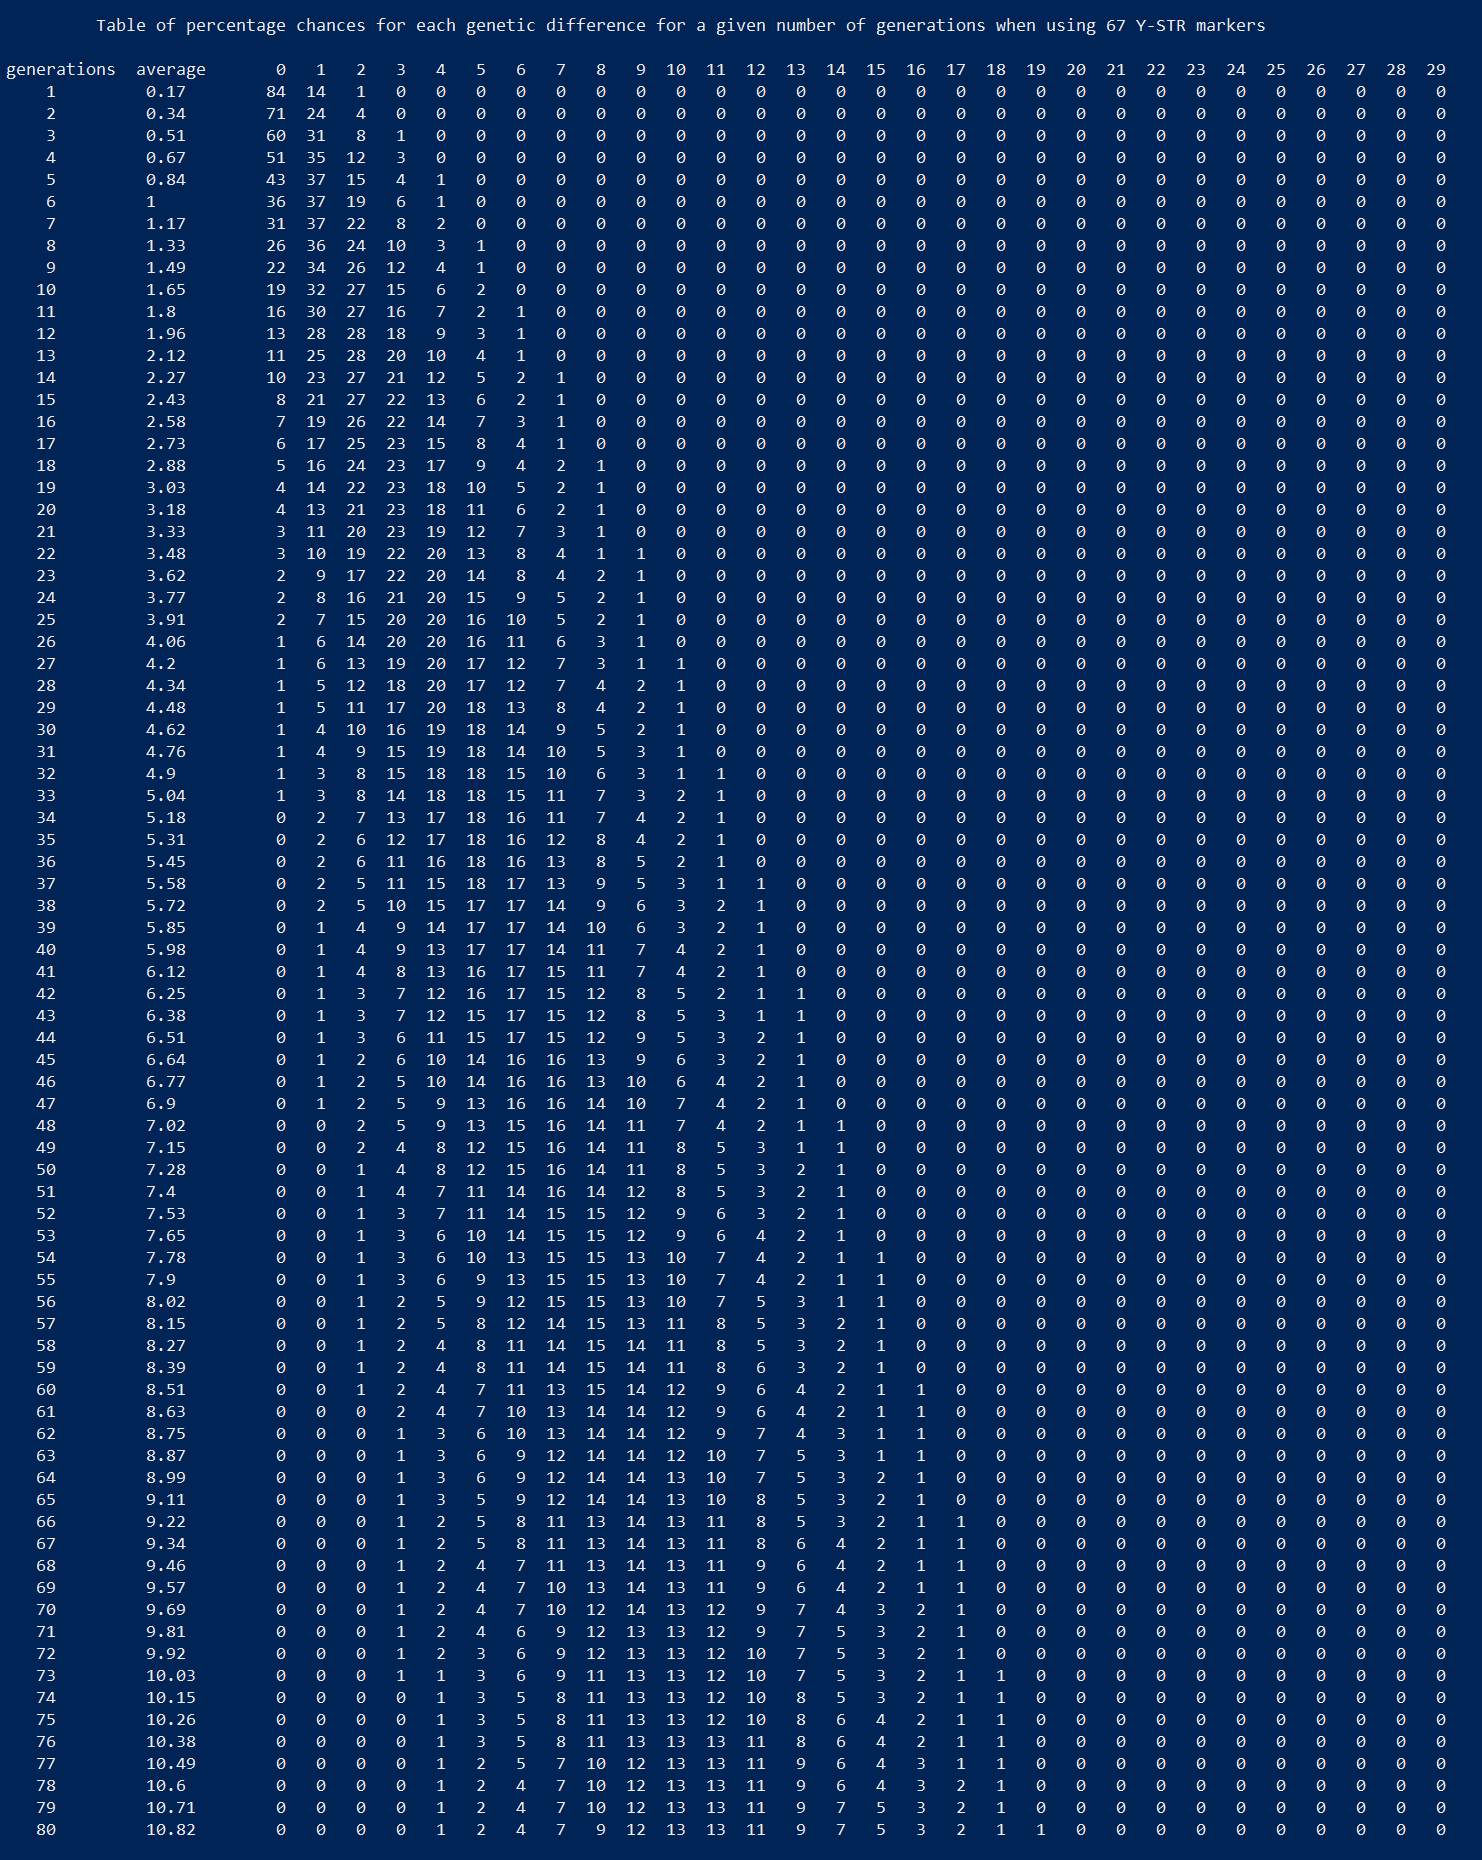
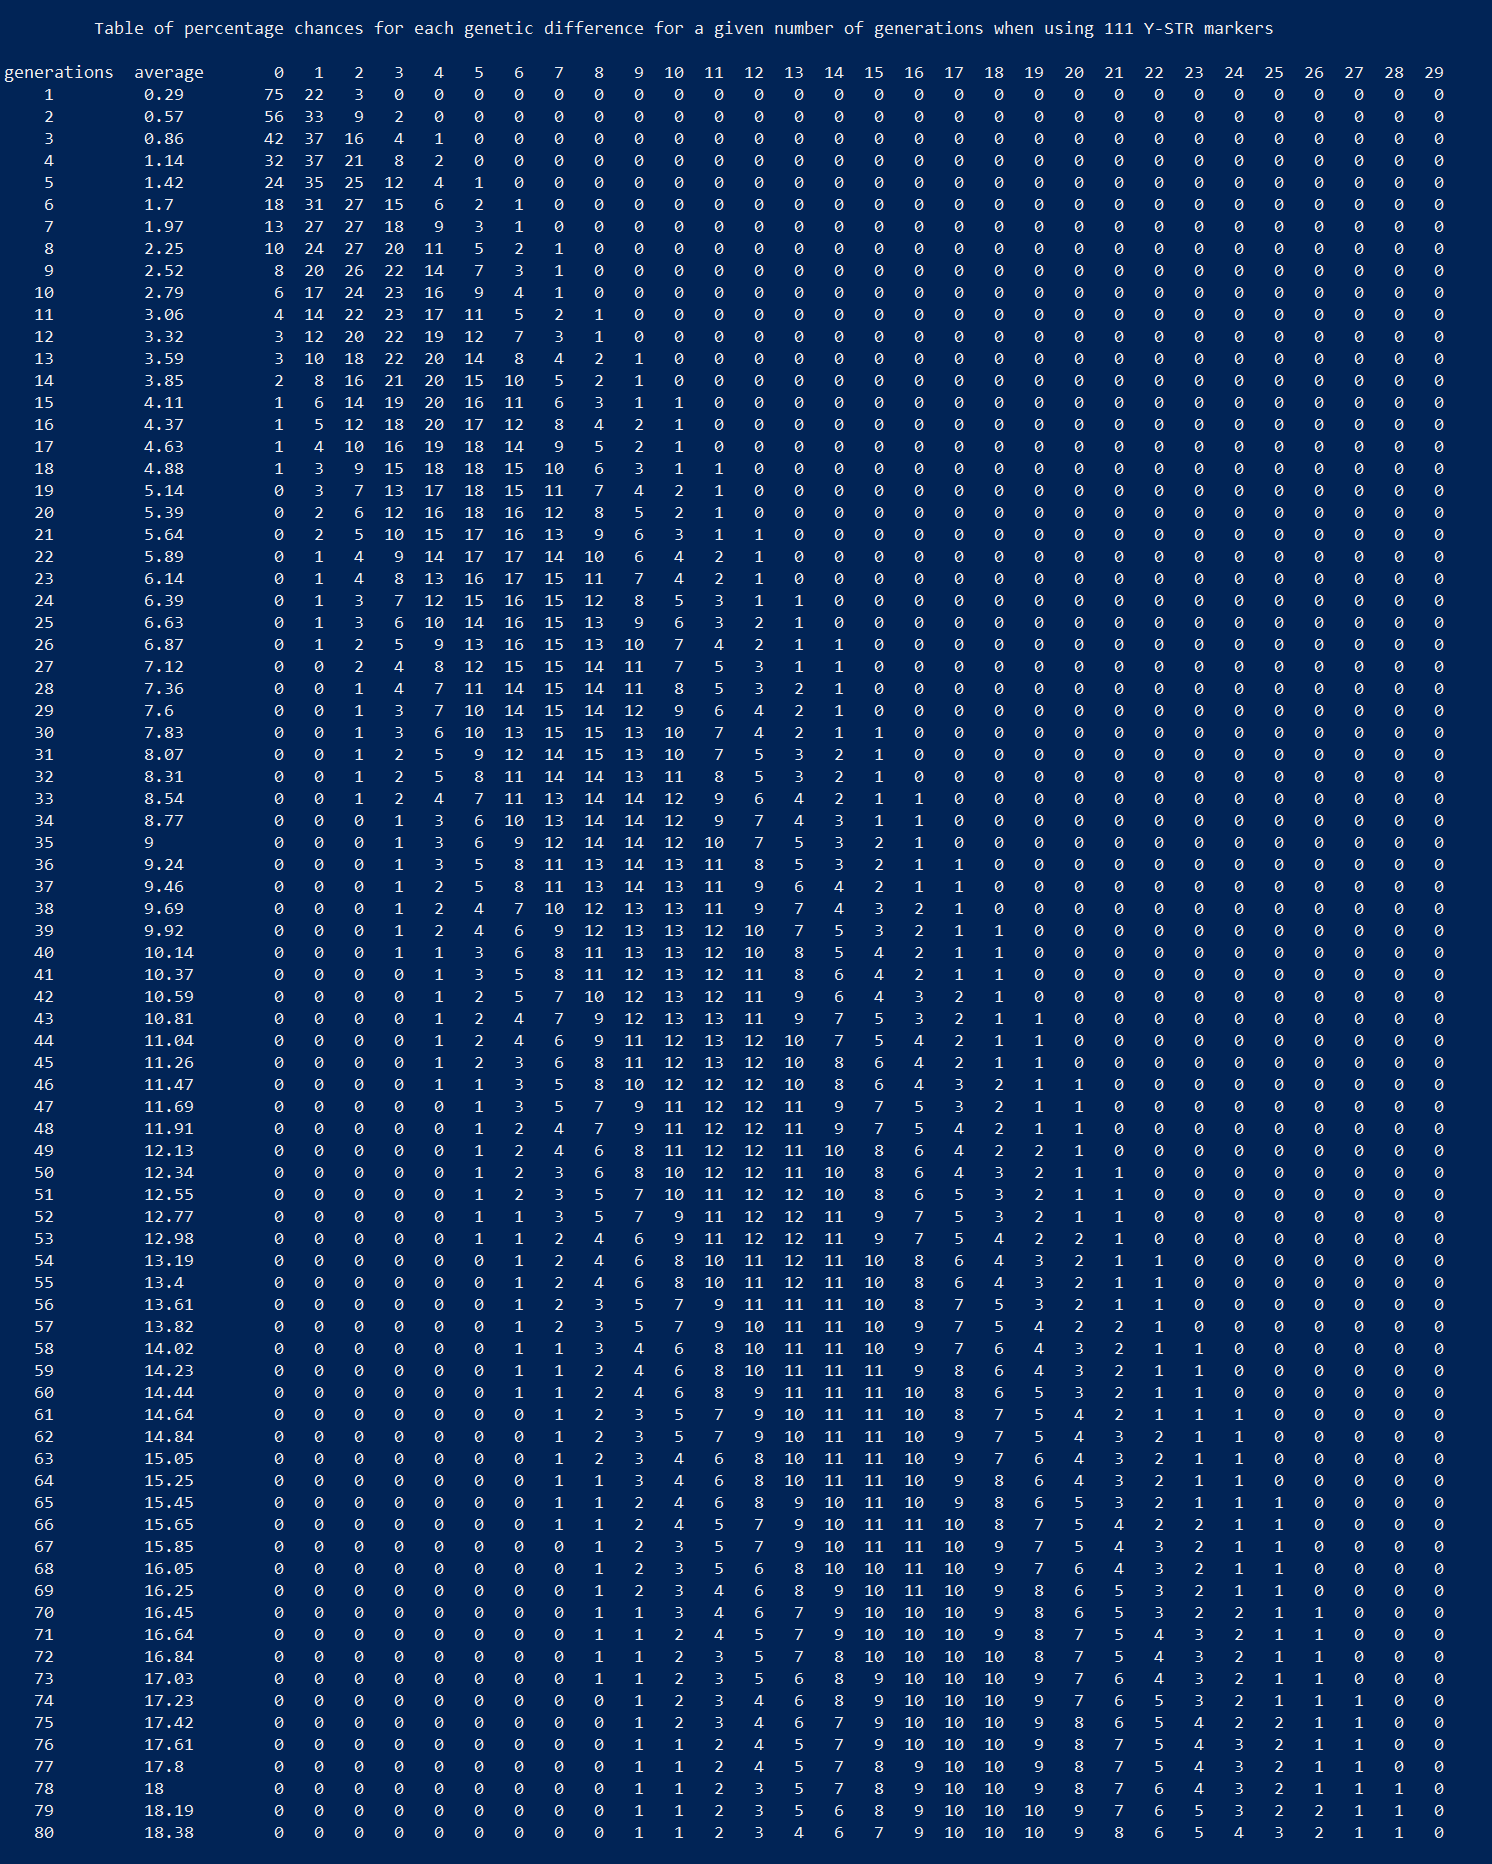
When comparing two Y-STR profiles, it is usual to compute the genetic difference between them. The above figures allow us to compute the tables needed to interpret that genetic difference. Specifically these tables show the percentage chance of each genetic distance having occurred after a given number of generations. Below are links to my calculated tables for each of the sets of YSTR markers used by FTDNA. (These calculations are based on the assumption that mutations always change a single marker by exactly one, and that this change is equally likely to be an increase or decease. The average quoted is the mathematical expectation.)
Looking at the first table we can observe that the average genetic difference of two Y37 samples are 8 generations apart is 1.02. Third cousins are 8 generations apart because each is separated by 4 generations from their most recent common ancestor. Over 16 generations (i.e. for seventh cousins) the average genetic difference is 1.97, or approximately double. (The number isn't exactly double because of the possibility of a second mutation reversing the effect of a previous one.) We can approximate the table by observing that the average genetic difference of two Y12 samples G generations apart is approximately G multiplied by 0.12 . (This approximation works well for practical genealogical purposes, but shouldn't be relied upon for very distantly samples with are hundreds or thousands of generations of separation.
Time to Most Recent Common Ancestor (TMRCA) calculation
We would like to use the genetic difference between two Y-STR samples to estimate how closely related they are. We can do this by multiplying the genetic difference by the value below. The result is the the estimated number of generations of separation. If both samples are from genelogical Y-DNA testing of living subjects then the number of generations of separation is twice the number of generations back to their most recent common ancestor.
| Y12 | Y25 | Y37 | Y67 | Y111 |
| 0.023 | 0.050 | 0.120 | 0.154 | 0.261 |
The above approach has some limitations. Firstly, it is only giving us the mid-point of a range of possibilities for the generations of separation. The fewer the markers used, the wider this range is, and the less reliable the estimate.
Secondly, the above calculations assume that the prior probabilities of each number of generations of separation are this same. Some of our ancestors had vastly more male line descendants than others however (as can be observed by looking at haplogroup sizes). If a DNA tester has a very large number of 40th cousins then, just by chance, some of them are likely to have descents with similar mutations, and to have much closer genetic differences than are predicted.
Quickly and Slowly mutating markers
As shown in the tables above, individual Y-STR markers vary widely in their mutation rates. Slower changing markers are useful in determining haplogroups, whilst faster changing markers are needed to understand more recent ancestry. The most rapidly changing 10 markers from the Y111 set are given below, together with their corresponding probabilities of mutating each generation.
| CDY | DYS710 | DYS712 | DYS576 | DYS449 | DYS570 | DYS714 | DYS650 | DYS458 | DYS534 |
| 0.03531 | 0.01828 | 0.01638 | 0.01240 | 0.00998 | 0.00928 | 0.00773 | 0.00758 | 0.00703 | 0.00686 |
Other factors affecting mutation rate
Other factors including the mutation rate can include the specific allele (i.e. the current repeat count for the marker) and the father's age. Different allele values also occur with significant different frequencies (see the Y-Chromosone STR Haplotype Reference Database for some examples).
Specific haplogroups will have predominant values for slower changing markers, reflecting the Y-STR profile of the common ancestor which they are defined by. This means that mutation rates for a given marker will tend to be similar within a haplogroup, and that more weight can be given to matches for alleles which are rare within that haplogroup.